
Read Multiline Exceptions on Mac: Find the Error and Open Its Call Trace
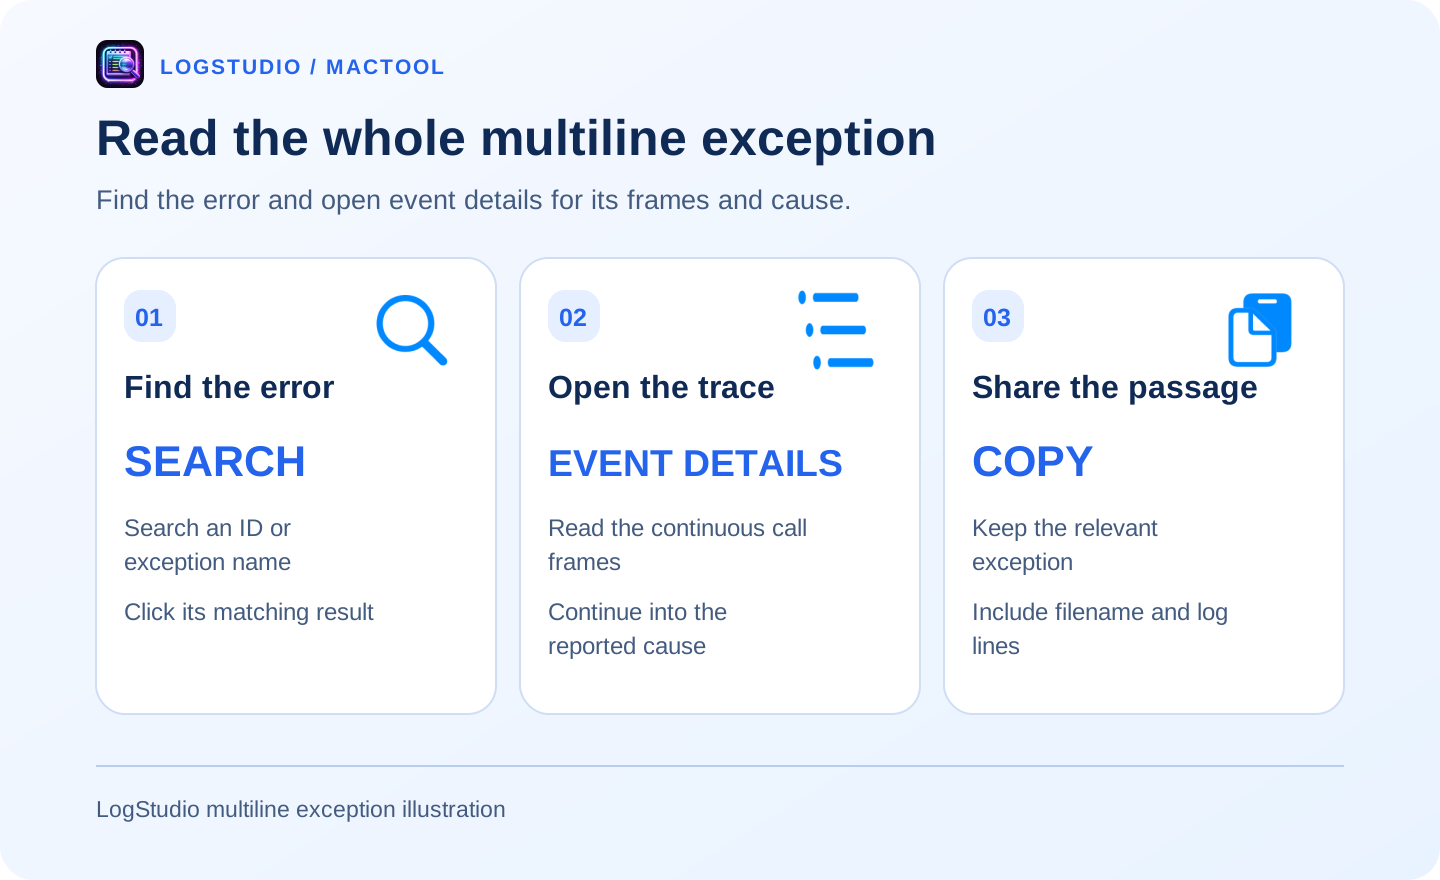
You find ERROR, but the explanation continues through many function calls. Copying only the first line leaves too much out. LogStudio shows recognized multiline exceptions in event details so you can read the name, call frames, and cause together.
A stack trace records the function calls associated with a failure. Since it spans multiple lines, read the passage as a whole.
Search the exception and reach its location
Open the log and search an identifier or exception name such as SocketTimeoutException. Click the result, select a related entry, and expand the Event tab in details.
LogStudio recognizes common Java, Python, Go, Node.js, and .NET text exception patterns. When a format is recognized, event details make the contiguous call records easier to read together.
Java: continue into Caused by
A simplified sample:
java.lang.IllegalStateException: cannot create order
    at example.OrderService.create(OrderService.java:42)
Caused by: java.net.SocketTimeoutException: read timed out
    at example.PaymentClient.read(PaymentClient.java:87)
The first line reports an order failure; Caused by adds a read timeout. The whole passage is more helpful than the outer error alone. Source filenames and lines give developers places to investigate.
Python: keep the ending too
Python traces commonly start with Traceback, while the final line gives the exception type and message. A JSONDecodeError, for example, describes a parsing position. Read from the call sequence through the ending in event details.
If grouping is incomplete, continue in the source view. Search context is useful for nearby lines; a particularly long exception needs a larger passage.
Return to the relevant request
Earlier records may describe the target, retries, and request parameters. Search the same request or drag backward to connect them with the exception. Back and forward revisit your earlier position.
Copy the event for a colleague with the filename and log line numbers. Keep source locations such as OrderService.java:42 separate so they can find both the log and code.
This guide concerns application text exceptions; use appropriate debugging tools for native macOS crash reports. See the search guide and LogStudio.
Frequently asked questions
How do I read a long exception together?
Search the error, select a related entry, and open the Event tab when a multiline exception is recognized.
Which common text formats are recognized?
Recognizes and displays common Java, Python, Go, Node.js, and .NET text exceptions.
Can I copy the exception for a colleague?
Yes. Copy it from event details with the source filename and original line numbers.